On February 12, 2026, the Phillies released Nick Castellanos and swallowed the remaining $20 million on his contract. Two days later, the Padres signed him for the league minimum. A player guaranteed $100 million walked out the door valued at $780,000. One stat explains the entire arc: Castellanos posted -0.8 WAR in 2025 and a total of 0.8 fWAR across his entire four-year Phillies tenure. Wins Above Replacement said Philadelphia would've been better off with a Triple-A call-up. Eventually, they agreed.
What WAR Measures
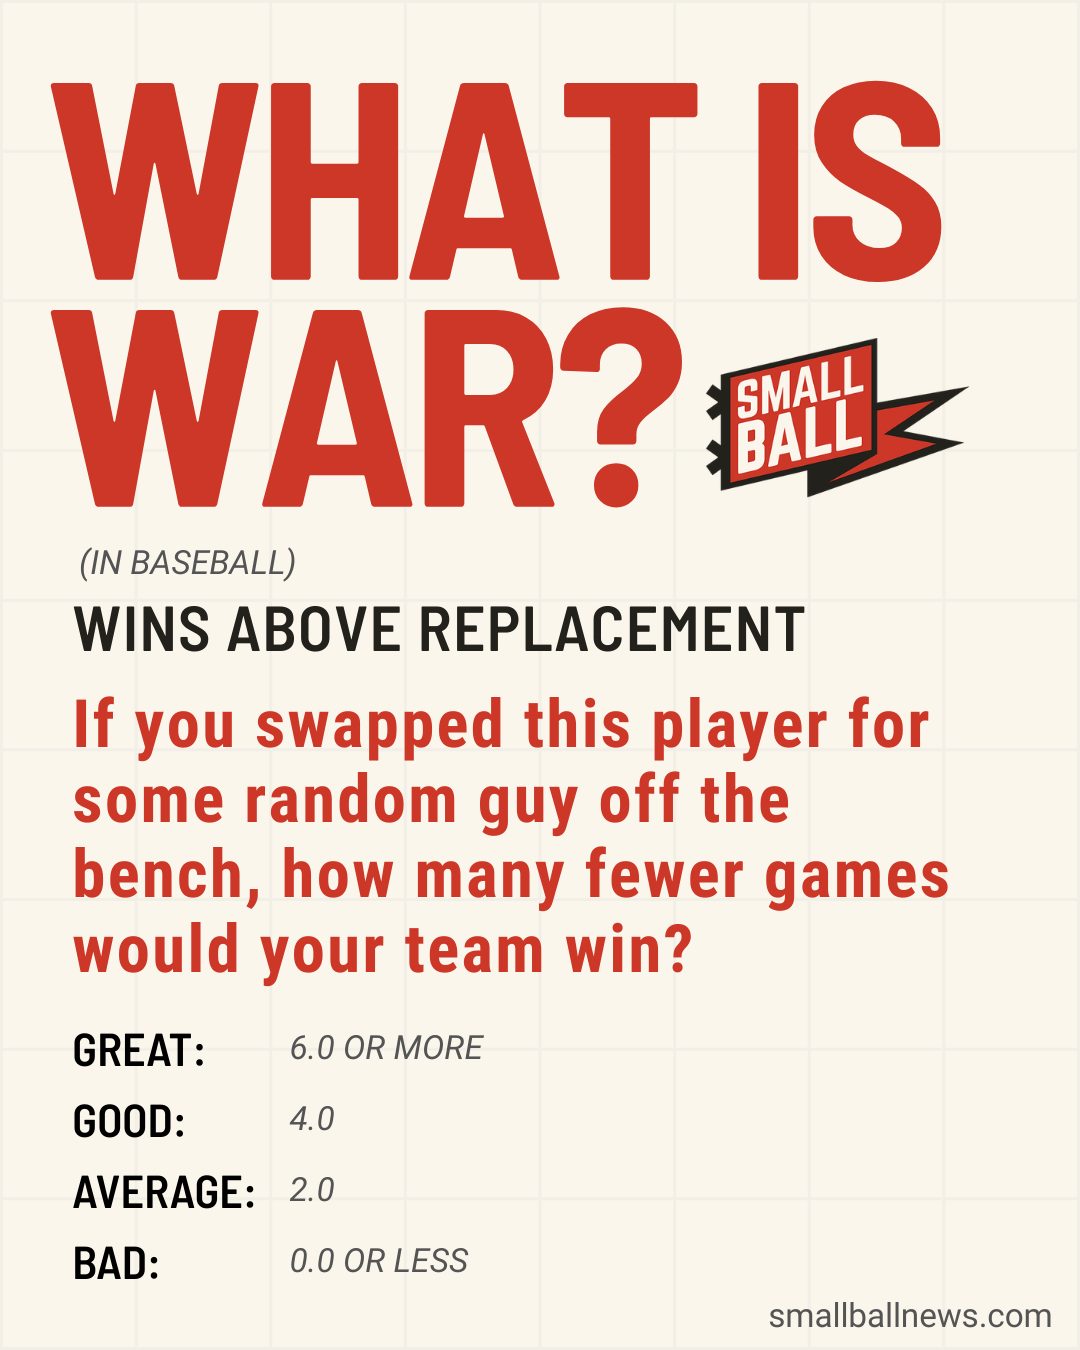
WAR attempts something no other baseball stat tries. It takes everything a player does on the field (hitting, fielding, baserunning, even the difficulty of his position) and collapses it into a single number. That number represents how many additional wins the player contributed compared to a freely available replacement-level alternative.
A replacement-level player is the hypothetical guy sitting in Triple-A that any team could sign tomorrow. He can field his position. He makes contact occasionally. But he's not actively winning you games. WAR measures how much better than that replacement-level baseline a player actually performed.
That simplicity is why WAR became the common language of baseball arguments. Every trade debate, every MVP ballot, every contract negotiation comes back to it. Scouts still trust their eyes. Front offices run proprietary models. But when someone needs to summarize a player's value in a single breath, they reach for WAR.
How the Calculation Works
Unlike OPS, which is simple addition, WAR is an assembly job. Multiple components get calculated independently, then stacked together.
For position players:
WAR = Batting Runs + Baserunning Runs + Fielding Runs + Positional Adjustment + Replacement Adjustment
All of it gets divided by roughly 10 runs per win to produce the final number.
- Batting Runs: Offensive value created, adjusted for park and league. Built from a stat called weighted on-base average (wOBA).
- Baserunning Runs: Stolen bases, extra-base advancement, tagging up, avoiding outs on the paths.
- Fielding Runs: How many runs a player saved or cost his team compared to average at his position.
- Positional Adjustment: Shortstop is harder than first base. WAR gives more credit to players at premium defensive positions.
- Replacement Adjustment: Shifts the baseline from "above average" to "above replacement," roughly 20 runs over a full season.
For pitchers, the formula swaps offensive components for pitching metrics, and the two major versions of WAR disagree sharply on how to do it.
The WAR Scale
| WAR | Classification | 2025 Example |
|---|---|---|
| 8.0+ | Inner-circle MVP | Aaron Judge (9.7), Cristopher Sanchez (8.0) |
| 5.0-7.9 | Superstar, MVP candidate | Cal Raleigh (7.3), Bobby Witt Jr. (7.1), Paul Skenes (7.6) |
| 3.0-4.9 | All-Star caliber | Strong everyday regulars |
| 2.0-2.9 | Solid starter | League-average full-time player |
| 1.0-1.9 | Role player | Useful bench or platoon bat |
| 0.0-0.9 | Replacement level | The Triple-A call-up |
| Below 0 | Below replacement | Someone is getting traded or DFA'd... |
A full-time position player who's dead average will post about 2.0 WAR over a season. That surprises people. "Average" sounds mediocre, but playing 150 games at a competent level is genuinely valuable compared to the replacement-level alternative. The guys clearing 6.0 are doing something extraordinary. Aaron Judge's 9.7 WAR in 2025 meant he was worth nearly 10 extra wins over a warm body. That's an entire month of baseball.
I track WAR across all 30 team digests at Small Ball, and it's the number that tells you the most about a player's long-term trajectory. Since it's comparative by design, it settles arguments you'd otherwise hand-wave through. Is your shortstop actually better than the one two divisions over? Check the WAR. You stop guessing.
When you start seeing a player dip below zero, you feel it before you ever check the stats. You grit your teeth every time he chases a slider in the dirt or takes a bad angle on a fly ball.
Negative WAR means the team would've been literally better off with whoever was hitting .270 on the farm.
Get daily baseball updates, free
Scores, recaps, standings and Vibe Checks every morning.
Two Versions of WAR (And Why They Disagree)
Most WAR explainers skip this part, and it matters. There isn't one WAR. There are two major versions: bWAR (from Baseball Reference) and fWAR (from FanGraphs). They share the same framework but diverge on two components that can swing a player's total by a full win or more.
Defense is the first disagreement. FanGraphs uses Ultimate Zone Rating (UZR). Baseball Reference uses Defensive Runs Saved (DRS). Both try to quantify how many runs a fielder saved or cost his team. Both are noisy, inconsistent year to year, and honestly the weakest link in the entire WAR calculation. I think defense is where WAR oversells its own precision. A player's offensive WAR component is stable and trustworthy. His defensive component can fluctuate wildly between systems and between seasons, which is a problem when you're packaging the whole thing as one authoritative number.
Pitching is the bigger split. FanGraphs uses Fielding Independent Pitching (FIP), which only counts outcomes a pitcher controls directly: strikeouts, walks, hit-by-pitches, and home runs. Everything else gets stripped out. Baseball Reference uses actual runs allowed, adjusted for team defense quality.
Cristopher Sanchez in 2025 makes the distinction concrete. He led all pitchers with 8.0 bWAR on the strength of a 2.50 ERA and 1.06 WHIP across 202 innings. His fWAR came in lower because FIP saw a pitcher whose strikeout rate, while improved, didn't fully account for that dominance. Baseball Reference credited the actual results. FanGraphs credited the results partially to the defense behind him.
Neither is "right." I check both and look at where they converge. When bWAR and fWAR agree on a player, like Judge at roughly 9.7 and 9.3, you can trust the number. When they diverge by more than a win, that's your cue to dig into the why.
When WAR Couldn't Explain the Season
WAR genuinely changed how baseball evaluates talent. Before it existed, comparing a Gold Glove shortstop to a slugging DH required guesswork and heated bar arguments. Now there's a common currency. Babe Ruth sits atop the all-time leaderboard at 182.6 career WAR, with Barry Bonds (162.8) and Willie Mays (156.1) behind him. That conversation exists because WAR exists.
But WAR is a player stat. It measures individual value. And baseball is a team sport in ways that individual stats are structurally blind to.
The 2024 Kansas City Royals went from 56-106 to 86-76 in a single season. Made the playoffs for the first time since 2015. Swept the Orioles in the Wild Card round. No individual WAR breakdown on that roster predicted a 30-win turnaround. The 2023 Arizona Diamondbacks were projected for 67.5 wins and won the pennant. Two years prior, they'd lost 110 games. Their aggregate player WAR wasn't a World Series roster. But from August on, they played like one.
Something beyond individual value was operating. Momentum. Collective confidence. The way a lineup feeds off a leadoff double in the third and carries that energy into the seventh. WAR can't see any of it, because WAR evaluates players in isolation. It sums up 26 individual stories and calls that a team. Anyone who watched those Royals or those Diamondbacks knows the whole was bigger than any sum of parts.
That gap is exactly what Small Ball's Vibe Check tracks: team-level momentum, streaks, and energy. The forces that individual WAR is structurally blind to. WAR tells you what each player was worth. Our Vibe Check tells you what the whole club feels like right now.
See What WAR Can't
The Small Ball daily digest delivers your team's Vibe Check score alongside the traditional stats every morning, free, before first pitch. WAR measures what already happened. Vibe Check measures what's building. Pick your team and subscribe.
 Arizona Diamondbacks
 Atlanta Braves
 Baltimore Orioles
 Boston Red Sox
 Chicago Cubs
 Chicago White Sox
 Cincinnati Reds
 Cleveland Guardians
 Colorado Rockies
 Detroit Tigers
 Houston Astros
 Kansas City Royals
 Los Angeles Angels
 Los Angeles Dodgers
 Miami Marlins
 Milwaukee Brewers
 Minnesota Twins
 New York Mets
 New York Yankees
 Oakland Athletics
 Philadelphia Phillies
 Pittsburgh Pirates
 San Diego Padres
 San Francisco Giants
 Seattle Mariners
 St. Louis Cardinals
 Tampa Bay Rays
 Texas Rangers
 Toronto Blue Jays
 Washington Nationals