On June 25, 2025, Juan Soto went 2-for-4 with a pair of solo home runs off Braves pitchers to pass Jimmie Foxx for the most multi-homer games in history before turning 27. His OPS that night climbed past 1.100 for the month. A month earlier, it had sat at .797. Same player, same swing, completely different offensive impact. OPS is the number that tells you exactly when that switch flipped.
What OPS Actually Tells You
On-Base Plus Slugging (OPS) measures two things at once: how often a hitter reaches base and how much damage he does when he connects. Those sound like they should be separate conversations, but OPS collapses them into a single number. A guy who walks a lot but never drives the ball isn't producing the same value as a guy who does both.
I see OPS more and more in everyday baseball coverage, and I think it's because fans are realizing that batting average alone doesn't cut it anymore. Understanding OPS honestly changed how I read a lineup card. It's the quickest way to see what separates the solid contributors from the bonafide stars, and it brings real clarity to questions like why a front office might publicly question whether a .261 hitter had an "elite" season.
Batting average treats every hit the same. A bloop single counts as much as a double off the wall. OPS doesn't make that mistake. It weights power production through slugging percentage, which means a hitter who consistently drives extra-base hits will separate from a contact-only guy even if their averages are similar.
The Formula (Yes, It's That Simple)
OPS = On-Base Percentage (OBP) + Slugging Percentage (SLG)
That's the whole thing. No exponents, no regression models, no weighted algorithms. Addition.
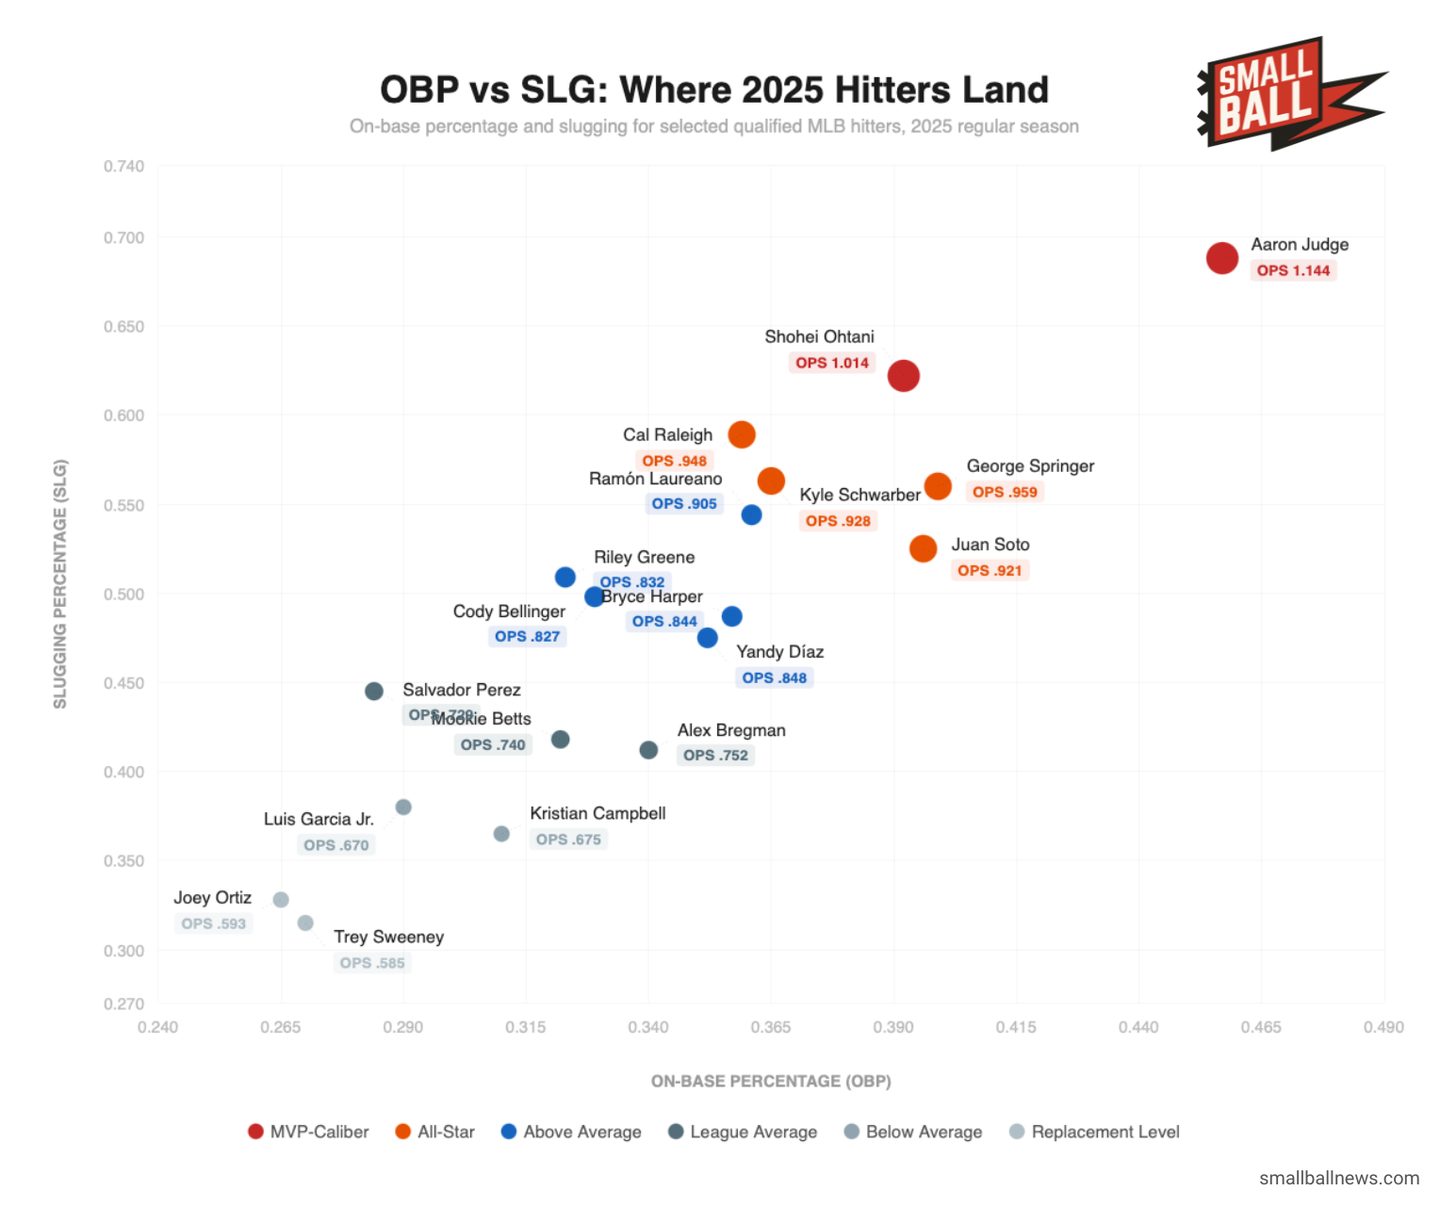
Take Aaron Judge's monster 2025 season with the Yankees. Per Baseball Reference, he posted a .458 OBP and a .686 SLG:
.458 + .686 = 1.144 OPS
That number led all of baseball. His OBP tells you he reached base in nearly half his plate appearances. His SLG tells you that when he hit the ball, he averaged more than a single's worth of bases. Combined, you're looking at the most productive offensive season in the majors.
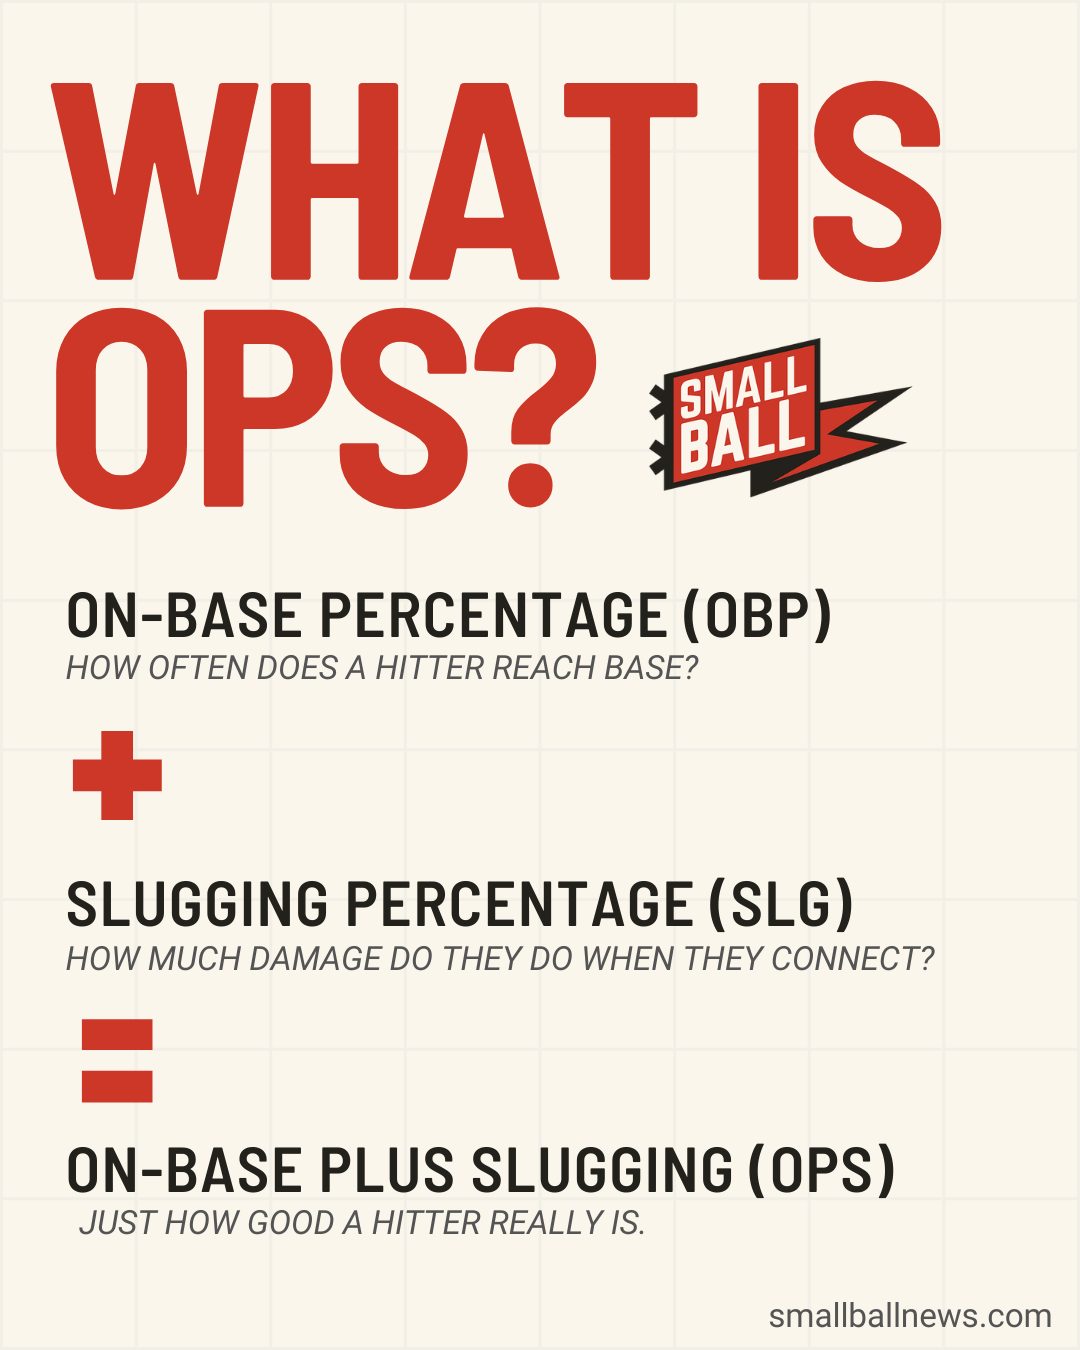
On-Base Percentage (OBP) counts every time a hitter reaches base (hits, walks, hit-by-pitches) divided by plate appearances. Slugging Percentage (SLG) divides total bases by at-bats, weighting doubles, triples, and homers more heavily than singles. A single equals one base. A homer equals four.
OPS Benchmarks: Where the Line Is
Here's how OPS breaks down across the talent spectrum, using 2025 full-season numbers:
| OPS Range | What It Means | 2025 Example |
|---|---|---|
| 1.000+ | MVP-caliber, historically elite | Aaron Judge (1.144), Shohei Ohtani (1.014) |
| .900-.999 | All-Star, legitimate star | Juan Soto (.921) |
| .800-.899 | Above average, solid everyday player | Bryce Harper (.844) |
| .720-.799 | League average to slightly above | Most starting lineups |
| .650-.719 | Below average | Defensive-first players |
| Below .650 | Poor, replacement-level offense | Bench bats, September callups |
The league-wide OPS in 2025 hovered around .700, which was actually the lowest it's been since 1989, per Baseball Reference. Offense has been trending down for a decade. That matters because an .800 OPS is worth more in a low-scoring environment than it was during the steroid era, when league average sat closer to .750.
The .800 line is the threshold most analysts use for "good." Above it, you're a clear positive. Below it, questions start.
Get daily baseball updates, free
Scores, recaps, standings and Vibe Checks every morning.
What OPS Gets Right (And Where It Falls Apart)
OPS works because it rewards the two things that actually score runs: getting on base and hitting for power. It penalizes empty batting averages and rewards patient hitters who draw walks. A .270 hitter with a .380 OBP and gap power will post a better OPS than a .300 hitter who never walks and only hits singles, and that's the correct ranking of those two players' offensive value.
It also travels across eras decently. An .850 OPS meant roughly the same thing in 2015 as it does now, even though run environments have shifted. That makes it a reliable comparison tool when you're looking at a player's career arc.
But OPS has a flaw that the analytics community has debated for years, and I think it matters more than most people acknowledge: OPS treats OBP and SLG as equally valuable, and they aren't. Research from FanGraphs and others has consistently shown that a point of OBP is worth roughly 1.7 times a point of SLG in terms of run production. A hitter who reaches base 38% of the time is generating more offense than a hitter who slugs .380, even though both contribute the same .380 to the OPS calculation.
This is why advanced metrics like wOBA exist. They weight each offensive event properly. But OPS persists because it's easy to calculate and easy to explain, and that trade-off between precision and accessibility is real. For a quick read on a player? OPS is excellent. For building a lineup model or evaluating a free agent contract? You'd want something more precise.
There's also the context problem. OPS doesn't adjust for ballpark or league. An .800 OPS at Coors Field isn't the same as an .800 OPS at Oracle Park. That's what OPS+ fixes (it adjusts for park and league, centering 100 as average), but raw OPS remains the version most fans encounter first.
Consider Bryce Harper's 2025. He posted an .844 OPS across 501 at-bats for the Phillies. Pretty good. Not great. And for a two-time MVP whose career OPS sits at .905, it was his lowest mark since 2016. That number is a big part of what drove Phillies president of baseball operations Dave Dombrowski to publicly say Harper "didn't have an elite season." An .844 OPS from a league-average first baseman is fine. From Harper, it raised legitimate questions about whether the decline was a blip (he missed a month with wrist inflammation) or a trend.
OPS made that conversation possible in one number. But it couldn't tell you whether Harper was pressing at the plate during the Phillies' October collapse, whether the wrist was still bothering him in ways the IL stint didn't capture, or whether the emotional weight of Dombrowski's comments might fuel a bounce-back year. I think it will, for what it's worth. But that's a gut read, not a stat.
The Part OPS Can't See
You watch 162 games and you develop a sense for when your team has something and when they don't. OPS won't tell you that. Nobody's .800 OPS is going to explain why the Mets felt like a different team once Soto got rolling in June, or why the Phillies felt flat in October despite a roster that should've gone deeper.
We track this across all 30 team digests every day at Small Ball, and OPS is one of the numbers that tells you the least about what's actually happening in a clubhouse. A lineup full of .780 OPS hitters can feel unstoppable when everything's clicking. The same lineup can feel dead two weeks later. The individual numbers don't change, but the output does.
That gap between what the stat sheet says and what the games feel like is exactly what Vibe Check measures. It tracks team momentum, streaks, and collective energy in ways that OPS and its cousins are blind to. Not a replacement for OPS. A complement to it, filling in the part of the picture that individual stats structurally can't.
Your Team's Full Offensive Picture, Every Morning
The Small Ball daily digest pairs traditional stats with your team's Vibe Check score, delivered free before first pitch. If OPS tells you what happened, Vibe Check tells you what's coming. Subscribe to your team's newsletter and see both sides.
 Arizona Diamondbacks
 Atlanta Braves
 Baltimore Orioles
 Boston Red Sox
 Chicago Cubs
 Chicago White Sox
 Cincinnati Reds
 Cleveland Guardians
 Colorado Rockies
 Detroit Tigers
 Houston Astros
 Kansas City Royals
 Los Angeles Angels
 Los Angeles Dodgers
 Miami Marlins
 Milwaukee Brewers
 Minnesota Twins
 New York Mets
 New York Yankees
 Oakland Athletics
 Philadelphia Phillies
 Pittsburgh Pirates
 San Diego Padres
 San Francisco Giants
 Seattle Mariners
 St. Louis Cardinals
 Tampa Bay Rays
 Texas Rangers
 Toronto Blue Jays
 Washington Nationals